Taming OpenTelemetry Complexity in Carrier Integration: Production Patterns for Managing Data Volumes Without Breaking the Budget

Your observability budget just tripled. Again. Those innocent-looking auto-instrumentation settings you rolled out six months ago are now generating data volumes 4-5x higher than expected, creating unsustainable costs for your carrier integration middleware. Sound familiar?
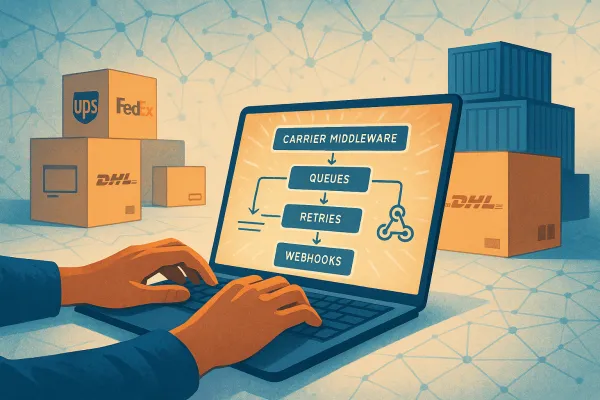
If you're architecting or operating carrier integration software that handles multi-carrier API routing, webhook delivery, and rate shopping across dozens of transport providers, implementation complexity and data management challenges aren't just theoretical concerns. They're daily operational realities that can overwhelm your infrastructure and budget.
Here's what we've learned from deploying OpenTelemetry observability in production carrier integration environments: the standard "instrument everything" approach doesn't scale. You need strategic sampling, focused instrumentation boundaries, and cost-aware deployment patterns that maintain visibility into critical failure modes without drowning in routine API call traces.
The OpenTelemetry Adoption Paradox in Carrier Integration
The promise looked straightforward enough. Deploy OpenTelemetry collectors, instrument your carrier adapter services, and gain unified visibility across your FedEx, UPS, DHL, and regional carrier integrations. OpenTelemetry's complexity can be overwhelming, with some comparing it to the "Kubernetes of observability".
The reality hits when your middleware processes 50,000 rate shopping requests daily across 15 carriers, each generating authentication flows, rate calls, service validation checks, and webhook confirmations. That's not 50,000 traces. That's potentially 750,000+ spans per day before you've added label generation, tracking updates, or exception handling flows.
European middleware vendors like nShift, Cargoson, and those building custom integrations for shippers face identical challenges. OpenTelemetry can be challenging for new developers to learn, requiring deep knowledge with high entry effort. The documentation assumes familiarity with distributed tracing concepts that many logistics developers encounter for the first time when implementing carrier connectivity.
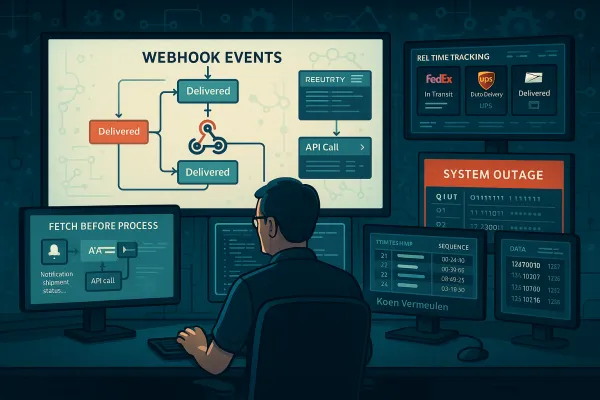
Consider a typical multi-tenant architecture handling carrier integrations for 200+ shipper accounts. Each tenant routes through different carrier combinations, uses different service levels, and triggers different webhook patterns. Auto-instrumentation captures everything: health checks, authentication renewals, sandbox test calls, and production shipments with equal fidelity.
Your observability platform doesn't distinguish between a critical failed delivery attempt that requires immediate attention and a routine sandbox label generation test. Both generate comprehensive trace trees with full context propagation, span attributes, and export overhead.
The Hidden Economics of Telemetry Data Explosion
Managing and storing telemetry data can become very expensive due to increasing volume, with containerized applications creating massive amounts of data. For carrier integration systems, this challenge compounds because of the distributed nature of transport workflows.
A single "create shipment" operation in your middleware might trigger:
- Rate shopping calls to 5-8 carriers (potentially 40+ spans)
- Service validation and transit time queries (15-20 spans)
- Label generation with carrier-specific formatting (8-12 spans)
- Webhook delivery confirmations to shipper systems (5-10 spans)
- Database updates for audit trails and status tracking (6-8 spans)
That's 75-100 spans per shipment. At 10,000 shipments daily, you're processing 750,000-1,000,000 spans. At current observability platform pricing of €0.10-0.30 per million spans, that's €75-300 daily just for trace ingestion, before metrics and logs.
Calculating Your True Telemetry Cost
Use this formula to estimate your carrier integration observability costs:
Monthly Cost = (Daily Shipments × Avg Spans per Shipment × 30 days) × Platform Cost per Million Spans
For a mid-market TMS handling 25,000 shipments daily with 80 spans per operation:
25,000 × 80 × 30 = 60 million spans monthly
60 × €0.20 = €12,000 monthly trace costs
Add metrics for API response times, error rates, and carrier SLA tracking (typically 2-3x trace costs), plus log ingestion for detailed error context (1-2x trace costs). Your total monthly observability spend reaches €36,000-72,000.
That's before considering webhook delivery retries during carrier outages, peak season traffic spikes, or the additional traces generated by your error handling and circuit breaker logic.
Strategic Sampling Patterns for Multi-Carrier Environments
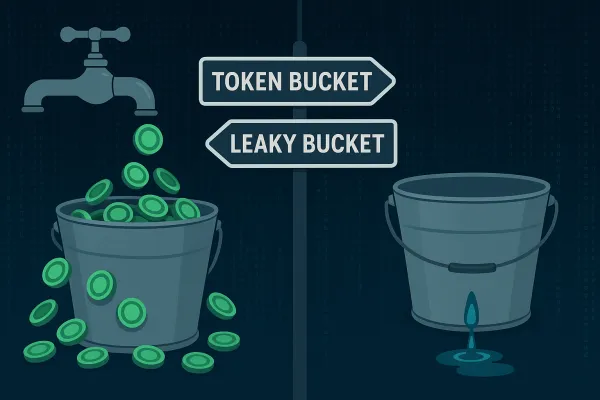
The solution isn't to abandon observability. It's to implement sampling as one of the most effective ways to reduce observability costs without losing visibility, with strategic patterns designed for carrier integration workloads.
For high-volume systems, sampling rates of 1% or lower can accurately represent 99% of data. But carrier integration requires nuanced approaches that account for business-critical vs routine operations.
Error-First Sampling: Sample 100% of traces containing API errors, authentication failures, or webhook delivery problems. These represent system health issues that require full context for diagnosis.
Carrier-Aware Adaptive Sampling: Apply different rates based on carrier reliability patterns. Sample 10% of FedEx API calls (historically stable) but 25% of regional carrier integrations that exhibit more variance in response patterns.
Business Impact Sampling: Sample 50% of production shipment creation but only 5% of rate shopping calls and 1% of tracking updates. Rate shopping generates high volume but routine patterns; shipment creation has higher business impact per trace.
Head vs Tail Sampling for Carrier Integration
Head sampling makes decisions at trace beginning before spans are created, while tail sampling decides after complete traces are collected. For carrier integration, the choice depends on your architecture.
Use head sampling when:
- Processing routine operations (tracking updates, rate shopping)
- Managing resource-constrained environments
- Handling predictable traffic patterns
Use tail sampling when:
- Error rates vary significantly across carriers
- You need complete traces for failed webhook deliveries
- SLA compliance requires full context for timeout scenarios
Example collector configuration for carrier-aware tail sampling:
processors:
tail_sampling:
decision_wait: 15s
policies:
- name: carrier-errors
type: status_code
status_code: ERROR
- name: webhook-failures
type: span_count
min_spans: 10 # Complex webhook retry patterns
- name: routine-operations
type: probabilistic
sampling_percentage: 2
Critical vs Non-Critical Instrumentation Boundaries
Not every API call deserves the same observability investment. Successful carrier integration observability focuses resources on high-impact instrumentation points while minimising overhead on routine operations.
Platforms like Cargoson, alongside enterprise solutions like Transporeon and Oracle Transportation Management, face similar decisions: where to invest observability effort for maximum operational insight.
The Essential Traces: What Never to Sample
Some operations require 100% trace collection regardless of volume:
Authentication and Security Events: Failed carrier API authentication attempts, expired certificates, or rate limit violations need complete context. These often indicate systemic issues that affect multiple tenants or carrier relationships.
Webhook Delivery Failures: Failed webhook deliveries to shipper systems represent broken integration contracts. Sample all webhook retry attempts, dead letter queue processing, and final failure notifications.
Cross-Carrier Routing Decisions: When your middleware selects between carrier options based on service levels, costs, or availability, capture complete decision context. These traces help optimize routing algorithms and identify carrier performance patterns.
Circuit Breaker State Changes: When circuit breakers open/close for carrier endpoints, you need full context about the conditions triggering state changes and the subsequent recovery patterns.
Configure these as sampling exceptions in your collector:
processors:
tail_sampling:
policies:
- name: never-sample-out
type: and
and_sub_policy:
- name: auth-failures
type: span_count
attributes:
- key: error.type
values: ["authentication_failed", "certificate_expired"]
- name: webhook-errors
type: status_code
status_code: ERROR
Production Deployment Patterns That Actually Work
Successful OpenTelemetry rollouts in carrier integration environments follow graduated deployment patterns that minimize risk while building operational confidence.
Gradual implementation and following best practices are crucial for production success. The "big bang" approach of instrumenting all carrier endpoints simultaneously creates operational blind spots when issues arise.
Start with **internal service boundaries**: instrument communication between your rate shopping service, label generation service, and webhook delivery service before adding carrier-facing instrumentation. This builds familiarity with trace correlation and sampling behavior using predictable, controllable traffic.
Progress to **single carrier integration**: select your most reliable carrier partner (typically FedEx or UPS in European markets) and instrument that integration completely. Learn sampling behavior, tune collector configuration, and establish baseline performance metrics.
Then expand to **multi-carrier scenarios**: add instrumentation for 2-3 additional carriers with different API patterns (REST vs SOAP, synchronous vs asynchronous responses). This reveals the configuration tuning needed for diverse integration patterns.
Collector Architecture for Carrier Integration Scale
Deploy collectors using a **tiered architecture** that matches your carrier integration traffic patterns:
**Edge Collectors** (sidecar deployment): co-located with carrier adapter services, handle high-frequency operations like tracking updates and rate shopping with aggressive head sampling (1-5% rates).
**Gateway Collectors** (standalone deployment): centrally process business-critical operations like shipment creation and webhook delivery with tail sampling and enrichment processors.
This pattern allows adaptive sampling to automatically adjust rates based on traffic patterns, capturing important information during busy periods while reducing unnecessary collection.
Managing Configuration Complexity at Scale
OpenTelemetry documentation can be less user-friendly and harder to navigate, often assuming prior knowledge. For carrier integration teams, this complexity multiplies when managing configurations across multiple carrier endpoints with different instrumentation requirements.
Create **template configurations** for common carrier integration patterns:
**REST Carrier Template**: standardized configuration for JSON-based APIs (FedEx, UPS APIs), including standard HTTP instrumentation, response time metrics, and error classification.
**SOAP/XML Carrier Template**: configuration optimized for traditional carrier APIs (TNT, some DHL services), with XML parsing instrumentation and envelope-based trace correlation.
**Webhook Delivery Template**: specialized configuration for outbound webhook processing, including retry logic instrumentation, dead letter queue tracing, and delivery confirmation tracking.
Use **GitOps approaches** similar to Adobe's implementation managing configurations through Git with OpenTelemetry Operator Helm charts. This provides version control for collector configurations and enables environment-specific tuning without manual deployment processes.
Store environment-specific variables (sampling rates, carrier endpoints, webhook URLs) in external configuration systems. This allows the same collector configuration to work across development, staging, and production environments with different observability requirements.
Future-Proofing Your Observability Investment
OpenTelemetry's rapid development cycle means keeping up with new features and updates while ensuring teams don't lag behind becomes an operational concern. For carrier integration systems that often run for years with minimal changes, this creates investment protection challenges.
Focus on **stable components first**: prioritize tracing instrumentation (generally available) over experimental logging features. Traces provide the highest value for understanding cross-carrier request flows and debugging integration failures.
**Version management strategies**: establish testing procedures for collector updates that validate sampling behavior and export functionality against your specific carrier integration patterns. Carrier APIs change infrequently; your observability configuration should be equally stable.
**Vendor-neutral positioning**: design your instrumentation to work with multiple observability backends. Solutions like MercuryGate and Descartes may need to adapt to different customer observability requirements, making vendor lock-in a competitive disadvantage.
The investment in properly configured OpenTelemetry pays dividends when your carrier integration faces production issues. A well-tuned observability system helps you identify whether a shipment creation failure stems from carrier API changes, network connectivity issues, authentication problems, or business logic errors.
Most importantly, it does so without overwhelming your infrastructure or budget with unnecessary trace data from routine operations. The goal isn't perfect visibility into every API call; it's actionable insight into the operations that matter for your shipper customers' success.
Start with focused instrumentation on business-critical paths, implement strategic sampling based on operation types and carrier reliability patterns, and gradually expand coverage as you build confidence in your configuration management and cost controls.